Essential insights to major industrial owners and occupiers.
Industrial Vacancy Study gives essential insights to major industrial owners and occupiers.
This report provides the current industrial vacancy rate for buildings over 10,000m2 across the three capital cities on the Eastern Seaboard.
Overall, we’re seeing very low vacancy rates – at 2% in Sydney, 3% in Melbourne and 4.2% in Brisbane.
The volume of speculative development activity that had pushed up vacancy rates has eased. There has been generally strong tenant enquiry for new premises, particularly as automation in warehousing gets genuine traction, resulting in strong recent construction numbers and land absorption. Land is now getting tight in many prime industrial locations, particularly for large contiguous lots to accommodate large format users.
Slice the data in multiple scenarios, by geography, grade or size.
See all vacant stock
|
|
Stock Evaluated |
Highest Vacancy Sub-Market |
Average Size of Vacancy |
Prime/Modern Vacancy Rate |
Secondary/Tertiary Vacancy Rate |
|
|
Melbourne |
15,000,000m² |
West ( 4.3%) |
15,600m² |
4.1% |
1.7% |
|
|
Sydney |
8,200,000m² |
Central West (3.0%) |
12,600m² |
1.2% |
3.7% |
|
|
Brisbane |
6,000,000m² |
South (6.0%) |
12,100m² |
3.7% |
4.9% |
INTERPRETING THE ANALYSIS
The study has targeted buildings of 10,000m2 or greater in Melbourne, Sydney and Brisbane. In total our analysis covers over 1,450 buildings and 29,000,000m² of industrial floor space.
Quality gradings have been applied to all buildings summarised as follows:
Prime – Buildings no older than ten years which suit a diverse range of occupiers. A minimum 8.5 metre internal clearance and extensive truck marshalling and hardstand areas.
Modern – Buildings between 10 and 20 years old, generally providing in excess of 7 metre internal clearance.
Secondary – Buildings between 20 and 35 years old, generally providing a minimum 6 metre internal clearance.
Tertiary – Buildings over 35 years old, most of which are unlikely to have many alternate users, other than discount short-term storage, upon vacation by the current occupier.
Included as vacant buildings, beyond those physically vacant, are buildings under construction and to reach practical completion within three months in addition to those currently occupied on a monthly tenancy or those where the current occupier is known to be relocating to alternate premises within the next three months.
Excluded from the study are buildings within the various sea Ports (e.g. Port of Melbourne, Botany and Brisbane) as they represent a narrow and specific (freight) industrial user group in addition to buildings outside the respective Metropolitan regions (e.g. Geelong, Warnervale, Newcastle).
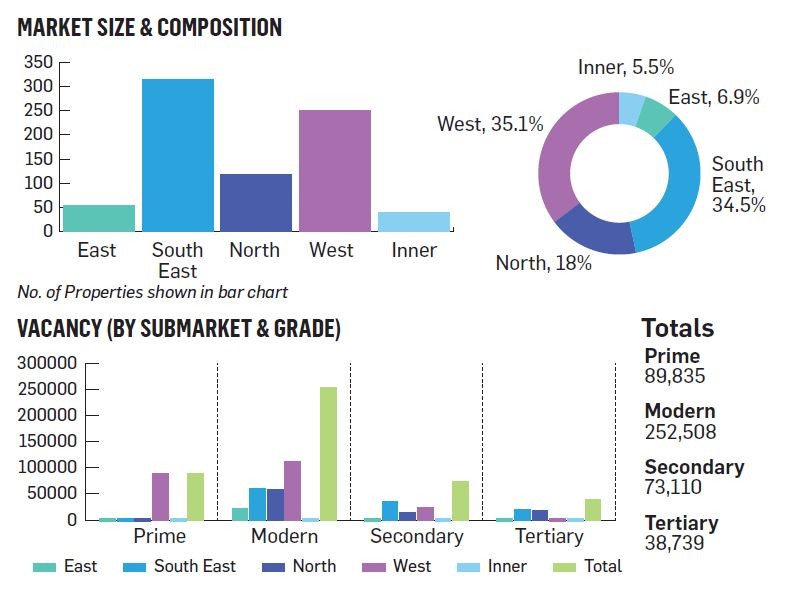
3% Vacancy Rate - Melbourne
Melbourne’s vacancy has fallen from 4.7% in Q1 2017 to 3% in Q3 2017.
This is the result of strong take up, active owner occupiers purchasing vacant stock and a reduction in the volume of speculative activity. The falling land supply pipeline, particularly in the south east, is likely to keep vacancies relatively low.
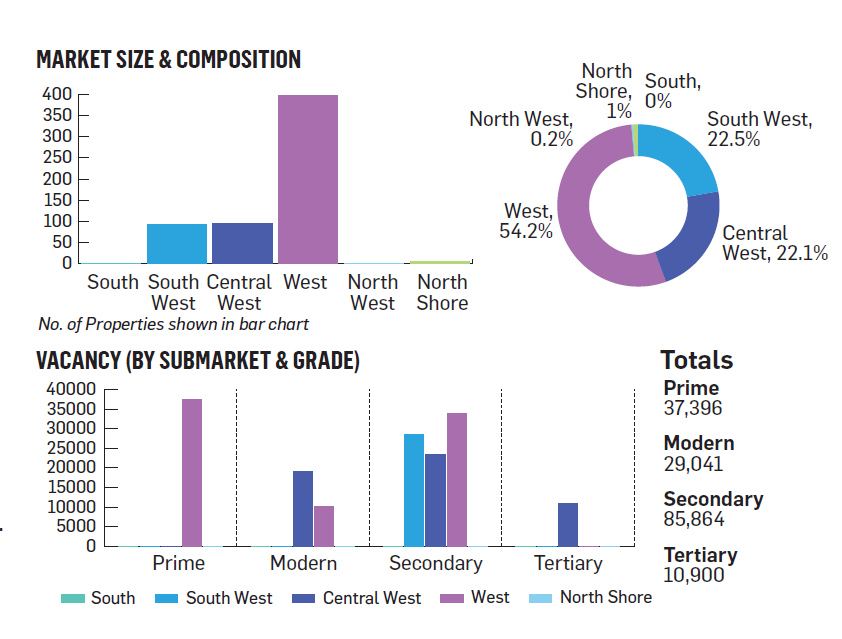
2% Vacancy Rate – Sydney
This is out inaugural industrial vacancy study for Sydney: at 2% we’re witnessing a very tight vacancy rate, particularly if you consider Prime and Modern building vacancy is just 1.2%.
This makes for a very challenging market for tenants to relocate. Sydney’s land supply remains tight and genuine rental growth and falling incentives must follow.
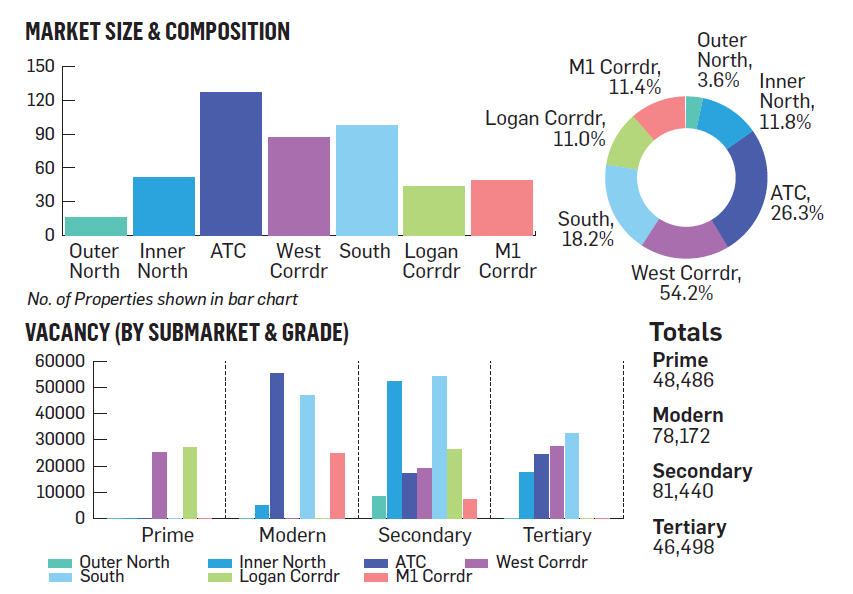
4.2% Vacancy Rate – Brisbane
From the perspective of owners and developers, Brisbane is a challenging market, yet improving.
The speculative development pipeline has been eased and vacancy is trending downwards. Australian Trade Coast (ATC), Brisbane’s largest sub market, has a lower vacancy rate of 3%.v

by Jessica Hammoud in Latest News
Archived Posts
- April 2025 (1)
- February 2025 (4)
- December 2024 (1)
- November 2024 (3)
- October 2024 (1)
- September 2024 (1)
- August 2024 (1)
- July 2024 (1)
- February 2024 (2)
- November 2023 (3)
- July 2023 (3)
- March 2023 (1)
- September 2022 (1)
- June 2022 (3)
- March 2022 (1)
- February 2022 (6)
- May 2021 (2)
- March 2021 (1)
- February 2021 (1)
- December 2020 (1)
- November 2020 (1)
- October 2020 (1)
- September 2020 (1)
- August 2020 (1)
- July 2020 (4)
- February 2020 (1)
- December 2019 (3)
- August 2019 (1)
- July 2019 (1)
- June 2019 (1)
- March 2019 (4)
- February 2019 (3)
- December 2018 (3)
- November 2018 (3)
- October 2018 (3)
- September 2018 (3)
- August 2018 (3)
- July 2018 (3)
- June 2018 (3)
- May 2018 (8)
- April 2018 (3)
- March 2018 (2)
- February 2018 (3)
- December 2017 (3)
- November 2017 (4)
- October 2017 (5)
- August 2017 (3)
- July 2017 (3)
- June 2017 (3)
- May 2017 (3)
- April 2017 (10)
- March 2017 (3)
- February 2017 (4)
- December 2016 (5)
- November 2016 (10)
- October 2016 (6)
- September 2016 (6)
- August 2016 (3)
- July 2016 (3)
- June 2016 (2)
- May 2011 (1)